← Architecture Studies
AI Infrastructure
Benchmarking LLMs at Scale: Architecting a Reproducible, GPU-Efficient Platform for Hundreds of Models a Day
Xariv Infrastructure··24 min
Architecture Study. This is a hypothetical system study. The scale figures, SLAs, and design choices are illustrative and do not describe any specific employer or production system. The aim is to reason from first principles about a class of problem — large-scale, high-fidelity performance benchmarking of inference systems — that recurs wherever teams must choose models, frameworks, and hardware on evidence.
1. Executive summary
We studied a hypothetical platform that benchmarks hundreds of LLMs every day across heterogeneous GPU clusters and reports latency, throughput, and cost. Scope is deliberately narrow: system-performance metrics only — TTFT (time to first token), inter-token latency, end-to-end latency percentiles, output tokens/sec, throughput, and GPU telemetry — no quality/accuracy scoring, offline batch evaluation only, dedicated GPU capacity, and strict reproducibility.
The headline finding reframes everything. This looks like a massive-scale distributed system, but the estimation says otherwise: the control plane dispatches roughly one job per second, the queryable dataset is ~50 GB/year, and the only genuinely large number is the GPU bill (~$7–10M/year). So this is not a throughput problem. It is a modest-throughput, high-cost, high-fidelity batch system, and the entire architecture is organized around three things the framing hides: trusting the number (reproducibility and measurement fidelity), placing work correctly (constraint satisfaction, not QPS), and spending GPU-hours wisely (efficiency and cost). This is the walkthrough.
2. Scope and the unit of work
Quality being out of scope is a large simplification: no labeled datasets, no LLM-as-judge, no human-in-the-loop. Offline-only removes any production-traffic tap. So we are essentially building a distributed load-testing and profiling harness for inference servers — define work, schedule it onto clean GPUs, measure, aggregate, store, compare.
The one thing that adds complexity, and is the heart of the problem, is the definition
of a benchmark setting: a fully-pinned, unique tuple of hardware type, CUDA version,
collective-library version (NCCL), serving-framework version (e.g. a specific vLLM
build), server config flags, and the workload shape — input/output token counts, the
request arrival distribution and its parameters, and payload args like max_tokens. That
whole tuple defines one reproducible experiment.
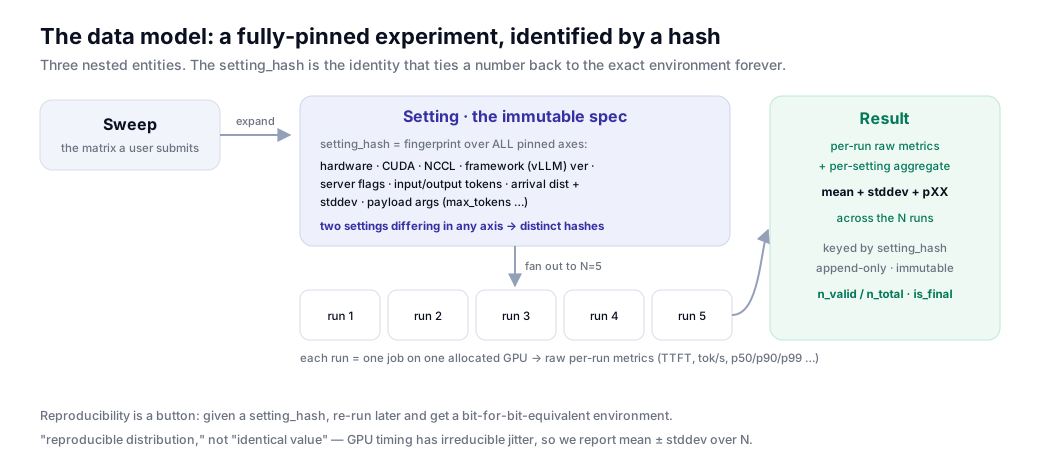 Figure 1. Three nested entities. The
 setting_hash — a fingerprint over every pinned axis — is the identity that ties a measured number back to the exact environment that produced it, forever.
Three entities follow: the Setting (the immutable spec, identified by its
setting_hash), the Run (one execution of a setting; N per setting), and the
Result (per-run raw metrics, plus the per-setting aggregate). Because true bit-level
determinism is impossible for GPU timing — thermal state and clock throttling introduce
real variance — reproducibility here means a reproducible distribution: we run N
iterations and report mean ± standard deviation, not a single value.
3. Scale estimation — where intuition flips
The cross product is given: 300 models × 5 hardware types × 4 suites = 6,000 settings/day. At N=5 iterations, that's 30,000 runs/day. A run isn't just the measured load test — it's provision, model load, warmup, measure, teardown — averaging ~15 minutes wall-clock, roughly a third of it non-measurement overhead.
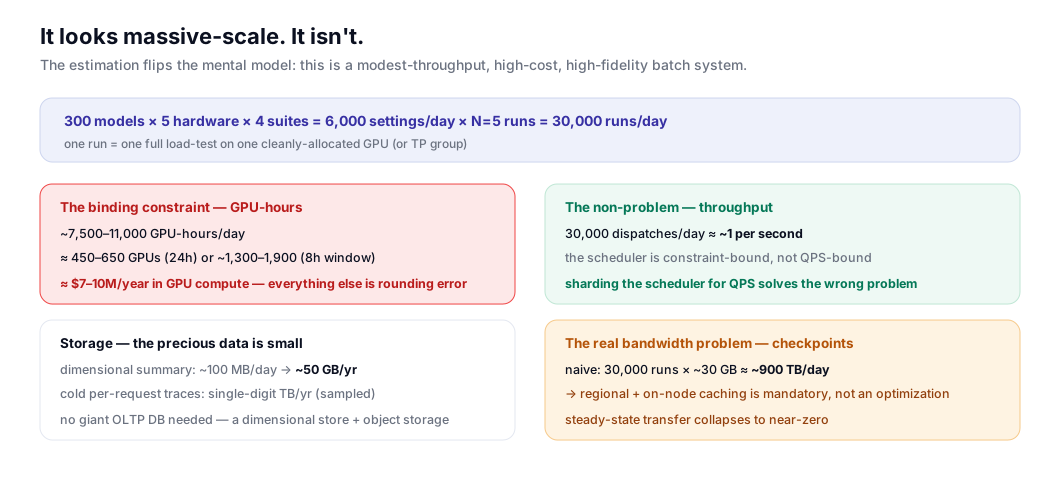 Figure 2. The estimation flips the mental model: the binding constraint is GPU-hours and dollars; throughput, storage, and request-scale are non-issues; the one real bandwidth problem is checkpoint staging.
The numbers fall out sharply. GPU-hours are the binding constraint: ~7,500–11,000/day (inflated for multi-GPU tensor-parallel settings), implying a fleet of ~450–650 GPUs run continuously, or ~1,300–1,900 to finish inside an 8-hour window — at a blended ~$2.50/GPU-hour, ~$7–10M/year. Everything else is rounding error next to that. Control-plane throughput is a non-problem: 30,000 dispatches/day is ~1 per second — so the scheduler is constraint-bound, not QPS-bound, and anyone sharding it for throughput is solving the wrong problem. Storage is tiny where it's precious: the dimensional summary is ~50 GB/year; bulky per-request traces are cold (single-digit TB/year, sampled). And the one real bandwidth problem is checkpoint staging — naively, 30,000 runs × ~30 GB ≈ ~900 TB/day, which makes regional and on-node caching mandatory, not optional.
The mental-model shift: the engineering pressure is on correctness, reproducibility, and GPU efficiency — not request volume.
4. Architecture — control plane / execution plane
Two ideas do the most work: a control-plane / execution-plane split, and the fact that the hard problems are correctness and placement, not load.
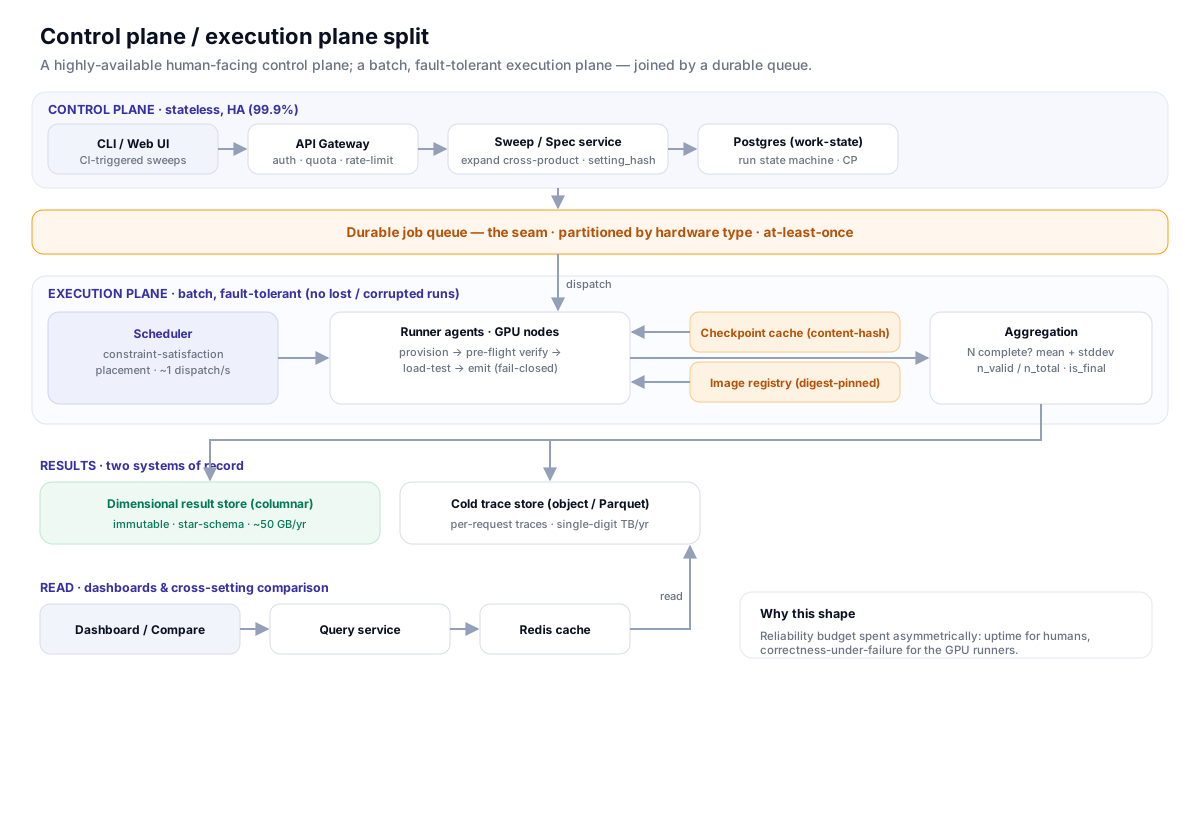 Figure 3. A highly-available, stateless control plane; a batch, fault-tolerant execution plane; a durable queue between them. Two systems of record — Postgres for work-state, a columnar store for results.
The control plane is stateless and highly available (humans depend on it live): a CLI
(the real workflow is "CI pushes a checkpoint → trigger a sweep") and web UI behind a
gateway, a Sweep/Spec service that expands the cross product into settings, computes
each setting_hash, and fans each setting into N runs, and Postgres as the
system-of-record for work-state and the run lifecycle (PENDING → PROVISIONING → RUNNING → COMPLETE/FAILED).
The durable queue is the seam — the single most important architectural decision. When a sweep expands, all 30,000 runs land here and drain as GPUs free up; at-least-once delivery means a runner dying mid-run loses nothing. It's partitioned by hardware type, so an idle L4 runner is never blocked behind an H100 backlog.
The execution plane is batch and fault-tolerant: a scheduler doing constraint-satisfaction placement, runner agents on GPU nodes, and checkpoint / image caches feeding them. Finished runs flow to an aggregation service that knows when all N are complete, handles partial completion explicitly, and computes mean + stddev + percentiles. Results land in two stores — a dimensional columnar store (the precious ~50 GB, immutable) and a cold trace store (object storage). A query service with a Redis cache serves dashboards and comparisons.
The defensible move: spend the reliability budget asymmetrically — real uptime for the control plane, correctness-under-failure (never lose or corrupt a run) for the execution plane, which is batch and doesn't need to be "up."
5. The runner — turning "we pinned it" into "we proved it"
Almost all the genuine engineering risk lives in two components. The first is the runner, and its guiding principle is fail-closed: if it can't prove the environment matches the spec, it refuses to produce a result.
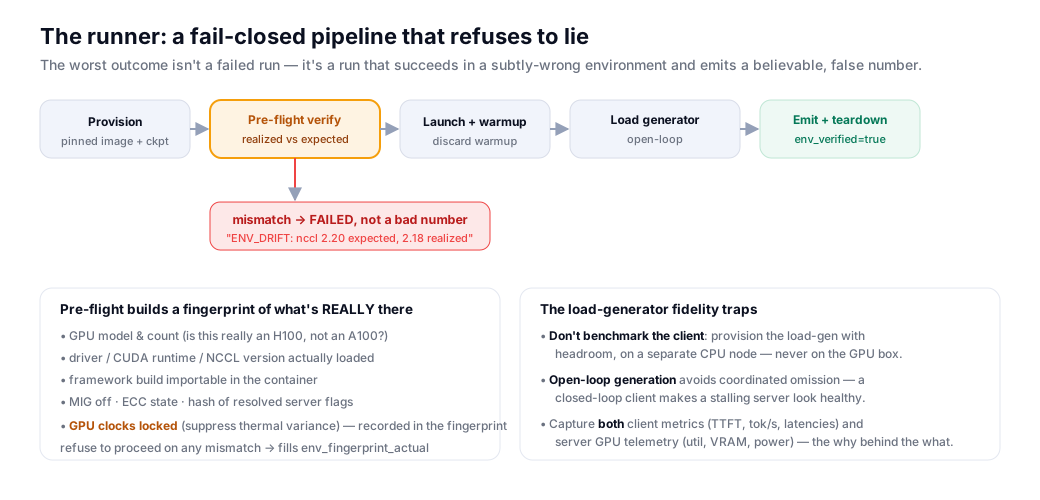 Figure 4. The worst outcome isn't a failed run — those are loud, and we retry them. It's a run that succeeds in a subtly-wrong environment and emits a believable, false number someone then makes a hardware decision on.
Everything ships in a digest-pinned container (CUDA, NCCL, framework baked in) and
the checkpoint is pinned by content hash, not a movable tag — because pip install vllm resolves differently on different days, and model:prod can move underneath you.
Then the heart of it: pre-flight verification builds a fingerprint of what's actually
realized — the GPU model the driver reports (is this really an H100?), the loaded
driver/CUDA/NCCL versions, the importable framework build, MIG and ECC state, a hash of
resolved server flags — and compares it to the setting's expected fingerprint, aborting on
any mismatch (ENV_DRIFT: nccl 2.20 expected, 2.18 realized). That comparison fills the
env_fingerprint_actual and env_verified fields and is the whole ballgame: if the
scheduler misplaced this run onto an A100, pre-flight catches it rather than emitting a
mislabeled number.
A senior detail: some variance is physical, not configurable. GPU clocks throttle with temperature, so the runner locks clocks to a fixed frequency and records the lock in the fingerprint — reducing controllable variance, then measuring the residual via N runs. And the most underestimated component is the load generator: it must not become the bottleneck (provision it with headroom on a separate CPU node, or you benchmark your client), and it must be open-loop to avoid coordinated omission — the classic bug where a closed-loop client stops sending when the server stalls and so never records the latencies it failed to send, making a struggling server look healthy at the tail.
6. The scheduler — placement, not throughput
The second risk-bearing component. At ~1 dispatch/sec there is no throughput problem; the hard job is constraint-satisfaction placement over a heterogeneous fleet.
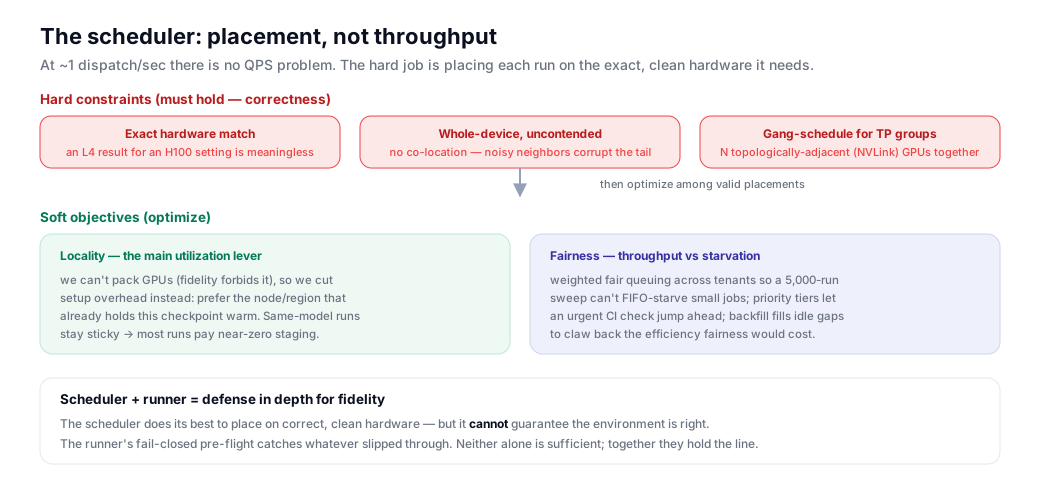 Figure 5. Hard constraints first (correctness), then optimize among valid placements (efficiency and fairness). The scheduler and runner are the two halves of one fidelity guarantee.
Hard constraints must hold: exact hardware match (an L4 result for an H100 setting is meaningless), whole-device uncontended allocation (no co-location — noisy neighbors corrupt the latency tail we exist to measure), and gang scheduling for tensor-parallel settings (N topologically-adjacent NVLink GPUs together, because cross-node interconnect would change the collective latency). This is a constraint-satisfaction + gang-scheduling problem, so build on an existing cluster manager (Kubernetes with the GPU device plugin, or Ray/Slurm-style gang scheduling) and add the domain layer above it.
Soft objectives optimize among valid placements. Locality is the main utilization lever: since we can't pack GPUs without wrecking fidelity, we attack setup overhead instead — prefer the node/region that already holds this checkpoint warm, keeping same-model runs sticky so most pay near-zero staging. Fairness prevents a 5,000-run sweep from FIFO-starving small jobs, via weighted fair queuing plus priority tiers (an urgent CI check jumps ahead of a nightly bulk sweep) plus backfill (let a lower-priority run fill an idle gap), which claws back most of the efficiency fairness would otherwise cost. The scheduler can place on the right hardware but cannot guarantee the environment is right — that's the runner's job. The two are defense in depth.
7. Storage and the comparison schema
The write rate (~30,000 runs/day, sub-1/sec) settles the SQL-vs-NoSQL question in a liberating way: there is no write-throughput problem, so we choose engines by query shape and correctness, not write scale — explicitly not reaching for wide-column NoSQL, which would cost us the joins and group-bys we need. The result is polyglot persistence: Postgres for work-state (genuinely relational, transactional, tiny), a columnar store for results, and object storage for cold traces.
The comparison feature lives or dies on the results schema, so design backward from the query we most need: pin every axis except one, vary that one, show the metric.
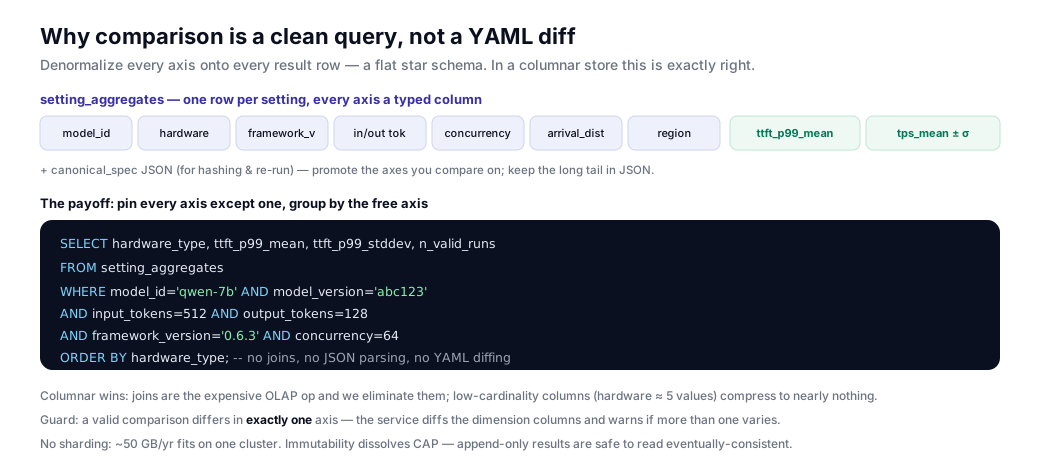 Figure 6. Denormalize every axis onto every result row — a flat star schema. In a columnar store this is exactly right, and it turns comparison into a clean WHERE + GROUP BY instead of a YAML-diffing exercise.
Two design choices carry it. First, the settings table holds both a canonical_spec
JSON (hashed for identity and re-run) and the comparison axes promoted to typed
columns — so "group by hardware" is a column scan, not JSON extraction, and the
setting_hash (computed over the whole spec) still distinguishes settings that differ
only in some un-promoted flag. Second, results denormalize every axis onto every row —
a flat star schema. In a row store that's wasteful; in a columnar store it's ideal: joins
(the expensive OLAP operation) vanish, and low-cardinality columns like hardware_type
(~5 values) compress to almost nothing. A valid comparison must differ in exactly one
axis, so the comparison service diffs the dimension columns and warns if more than one
varies — catching the silent apples-to-oranges error where an unpinned axis collapses
multiple settings together.
We don't shard (~50 GB/year fits on one cluster — reflexively sharding a 50 GB dataset
means you stopped listening to your own estimation). And immutability dissolves CAP:
results are append-only, so there are no write-write conflicts and eventual consistency on
reads is fine; the only CP need is the small mutable work-state in Postgres, where I'd
rather block briefly during failover than double-dispatch a run. The one invariant that
isn't free is aggregation completeness — "compute the mean only when all N are done"
is an application rule, made auditable by storing n_valid_runs/n_total_runs and an
is_final flag, so a setting that completed 3 of 5 publishes the mean of 3 with the count
visible, never a silent average of fewer samples.
8. Caching, reliability, and cost
Caching here is mostly about keeping expensive GPUs from idling, not read latency. Because checkpoints and images are content-addressed and immutable, the hardest cache problem — invalidation — simply doesn't exist. A multi-tier checkpoint hierarchy (global object store → regional mirror → on-node NVMe, LRU-evicted) plus the scheduler's locality stickiness means most runs hit a warm local copy; predictive prefetch (warm the next model's weights onto a soon-to-be-free node while the current run still measures) pipelines staging behind useful work. The real stampede risk isn't Redis — it's a checkpoint thundering herd when a new model's runs all cold-miss at once, solved with single-flight staging (one node pulls, the rest wait) and not fanning a new model's first runs across hundreds of cold nodes simultaneously. The Redis result cache is the easy one: immutable aggregates cache with long TTLs, cache-aside, near invalidation-free.
Reliability spends its budget asymmetrically. The queue's at-least-once delivery means
no run is lost; idempotent, attempt-scoped, append-only result writes mean a redelivered
run writes a fresh (run_id, attempt_number) row that the aggregator dedupes by selecting
valid attempts — so at-least-once delivery is rendered safe rather than double-counting.
Every failure (crash, OOM, preemption, env drift) resolves to the same outcome:
discarded-and-retried, never partial-and-counted. A dead-letter queue catches runs that
deterministically fail (a setting that genuinely won't fit the GPU) so they don't retry-loop
and burn GPU-hours forever. The fidelity failures unique to this system — a run that
succeeds but is silently wrong — are caught not by retries but by fail-closed pre-flight
and honest valid-run accounting.
Cost is mostly clean arithmetic, because every run is a discrete unit on known hardware
for a known duration: gpu_count × hold_duration × versioned_rate. Two honest decisions:
attribute the full hold-time (the GPU was held exclusively, so setup overhead is real
cost — and storing billable_gpu_seconds vs measured_gpu_seconds makes the overhead an
efficiency signal); and allocate idle capacity via proportional showback by default,
reservation-aware for capacity planning — preferring showback (visibility) over hard
chargeback, which invites teams to game attribution. Because every result row carries
all its axes, cost rolls up per team, per model, per sweep, or per hardware for free — and
cost-per-million-tokens at a target p99 becomes a decision-grade metric alongside
latency, the question that actually drives hardware choices.
9. Security, observability, and geo-distribution
Security here isn't a PII problem — it's IP protection and expensive-capacity protection. The crown jewels are fine-tuned checkpoints (valuable IP) and the GPU fleet (abusable spend). So "permission to spend GPU-hours" is treated as a privileged capability gated by quota (an unauthorized sweep isn't a data breach, it's a five-figure bill), checkpoint access is scoped and audited, and we benefit hugely from a trusted-code threat model — we run only our own pinned images, not user-supplied harnesses, which shrinks the attack surface dramatically. Digest-pinned, signed images give us supply-chain integrity almost for free, because reproducibility already wanted immutable, verified artifacts.
Observability has a constraint no normal system has: there are two separate concerns — platform health (ops telemetry, alert-on) and the measurements themselves (dimensional data, query-and-compare) — and observing the second too aggressively corrupts it. A heavyweight metrics agent on the GPU node steals SM cycles and perturbs the very latency it measures, so measurement collection must be low-overhead and asynchronous, off the critical path. The SLOs are unusual — about makespan and fidelity, not request latency ("the nightly sweep completes within the off-peak window 95% of nights," "≥98% of runs pass pre-flight"). And the scariest failure to detect is the silently-incomplete sweep — a dashboard that looks populated but rests on 60% of the intended runs — which is exactly why valid-run accounting is both stored and alerted on.
Geo-distribution is driven by "go to where the GPUs are," not "be near users." So execution is region-local (a run executes where its hardware and checkpoint live — streaming a 140 GB checkpoint cross-region per run is the ~900 TB/day disaster), while the control plane and results store are global. Results geo-replication is genuinely easy because results are append-only and eventually-consistent. A region loss degrades throughput, not availability — pending runs back up and drain on recovery — which is the right failure mode for a batch system. Checkpoint replication policy becomes a capacity-planning lever: replicate a hot model widely to unlock more regions' GPUs, at a storage/egress cost.
10. Evolution — MVP → 10x → 100x
The unusual property: the software barely changes across three orders of magnitude; the economics and operational discipline change enormously, because the scaling bottleneck was always dollars and GPUs, never code.
At MVP, build only the irreducible core — can I run a pinned benchmark on the right GPU and trust the number? Single region, vanilla Kubernetes for hard-constraint placement, Postgres doing double duty (work-state and results — ~50 GB is nothing), comparison as a SQL query. The runner's full pre-flight and an open-loop load generator are non-negotiable even at MVP, because a harness that produces untrustworthy numbers has negative value. Defer the columnar store, Redis, multi-region, fairness, prefetch — the estimation proved we don't need them yet.
At 10x, the single-node simplifications crack on concurrency, not size: split results into a columnar store, add Redis, and — the real driver — multi-tenancy forces fairness, quota, and priority into the scheduler, while checkpoint staging cost forces the cache hierarchy and locality to become first-class. The fleet goes multi-region. Cost graduates from a derived column to a real showback system. Crucially, nothing is re-architected — the deferred pieces activate along seams the design already anticipated.
At 100x, the punchline lands: the control plane is still trivially loaded (~100
dispatches/sec), so the dominant problem becomes the GPU bill itself (potentially
$700M–1B/year), and the work flips to economics — adaptive N (fewer iterations where
variance is already low), and the highest-leverage feature of all, dedup / change-aware
skipping: using the immutable, hash-keyed result store to ask "do I already have a valid
result for this exact setting_hash?" and not run a redundant 30,000-GPU-hour sweep. The
cheapest GPU-hour is the one you don't spend.
11. Key takeaways
- It looks massive-scale but isn't. It's a modest-throughput, high-cost, high-fidelity batch system — recognizing that request-scale machinery is unnecessary is half the answer.
- GPU-hours are the binding constraint (~$7–10M/year); everything else is rounding error, which makes utilization, cost attribution, and running fewer redundant benchmarks first-class.
- The scheduler is constraint-bound, not throughput-bound — its hard job is correct, clean, gang-scheduled placement on the exact pinned hardware, at ~1 dispatch/sec.
- Fidelity is upheld by the runner + scheduler pair — fail-closed pre-flight verification plus uncontended placement; this is where the real engineering risk lives.
- Immutability is the connective tissue — content-hashed artifacts and append-only results make caching invalidation-free, at-least-once delivery safe, geo-replication trivial, and at 100x even enable dedup-based skipping.
12. Open questions
- What is the right adaptive-N policy — how do you decide, per setting, how many iterations buy a stable enough mean without wasting GPU-hours?
- How aggressively can change-aware skipping prune a nightly sweep before you risk missing a real regression from an un-pinned source of drift?
- Can predictive checkpoint prefetch driven by queue look-ahead be made accurate enough to keep GPUs near-continuously busy on large-checkpoint sweeps?
- What's a credible standard for measurement-fidelity auditing — proving a published number wasn't perturbed by the harness itself?
References
- V. J. Reddi et al., MLPerf Inference Benchmark, ISCA 2020 (arXiv:1911.02549).
- G. Tene, How NOT to Measure Latency (coordinated omission) and the HdrHistogram project.
- W. Kwon et al., Efficient Memory Management for Large Language Model Serving with PagedAttention (vLLM), SOSP 2023 (arXiv:2309.06180).
- A. Verma et al., Large-scale Cluster Management at Google with Borg, EuroSys 2015.
- M. Schwarzkopf et al., Omega: Flexible, Scalable Schedulers for Large Compute Clusters, EuroSys 2013.
- P. Moritz et al., Ray: A Distributed Framework for Emerging AI Applications, OSDI 2018 (arXiv:1712.05889).
- A. Yoo, M. Jette, M. Grondona, SLURM: Simple Linux Utility for Resource Management, JSSPP 2003.
- D. Karger et al., Consistent Hashing and Random Trees, STOC 1997.
- A. Vattani, F. Chierichetti, K. Lowenstein, Optimal Probabilistic Cache Stampede Prevention, VLDB 2015.
- S. Melnik et al., Dremel: Interactive Analysis of Web-Scale Datasets, VLDB 2010.
- NVIDIA documentation — NCCL, Multi-Instance GPU (MIG), Nsight Systems, and Data Center GPU Manager (DCGM).
- Kubernetes device-plugin / GPU scheduling, ClickHouse, and Apache Parquet — official documentation.
Part of an ongoing architecture-study series. Where the companion pieces optimized the model (kernel fusion, MoE networking) and the retrieval around it (per-user RAG), this one is about how you'd measure any of them at scale — and why, at this scale, the hard part isn't speed but trust.