← Architecture Studies
AI Infrastructure
Kernel Fusion for Large-Scale LLM Inference: When GPU Memory Bandwidth, Not Compute, Is the Bottleneck
Xariv Infrastructure··18 min
Architecture Study. This is a hypothetical system study. The model, numbers, and traffic patterns are illustrative and do not describe any specific employer or production deployment. The aim is to reason from first principles about a class of problem common to high-volume, short-form LLM serving.
1. Executive summary
We studied a hypothetical AI search answer-generation platform — the surface that returns a synthesized "AI overview" answer instead of ten blue links — running a 32B-parameter dense LLM on a single NVIDIA H100, at a scale of billions of requests per day and 10k+ QPS at peak, with a p99 < 500 ms target.
The model fit comfortably on one GPU, the queue was shallow, and GPU utilization looked healthy at ~52%. Yet throughput sat below target and time-to-first-token was sluggish. The instinct was to add GPUs. Profiling said otherwise.
The decode path was memory-bandwidth bound, not compute-bound. The GPU spent its time moving intermediate tensors in and out of HBM and paying kernel-launch overhead on dozens of tiny operations per token — while the compute units idled. The fix was not more hardware; it was kernel fusion, delivered through TensorRT-LLM and vLLM (plus FlashAttention and CUDA Graphs), which cut memory traffic and launches and lifted throughput roughly 1.7× at identical model quality. This is the investigation, end to end.
2. Business context
Short-form answer generation has an unusual and unforgiving cost profile.
- Volume is internet-scale. Billions of queries a day, 10k+ QPS at peak.
- Latency is the product. A slow answer is a lost user; the SLO guards the p99.
- Outputs are short. Answers are often under 40 tokens — a sentence or two.
- Margins are thin. Cost per answer has to stay low for the surface to be viable.
That last pair — short outputs at huge volume — is what makes this an infrastructure problem. Each request does little work, so fixed per-step inefficiencies (launch overhead, redundant memory movement) are not amortized away by a long generation. They dominate. A 15 ms saving per request looks trivial until you multiply it by billions.
3. Architectural overview
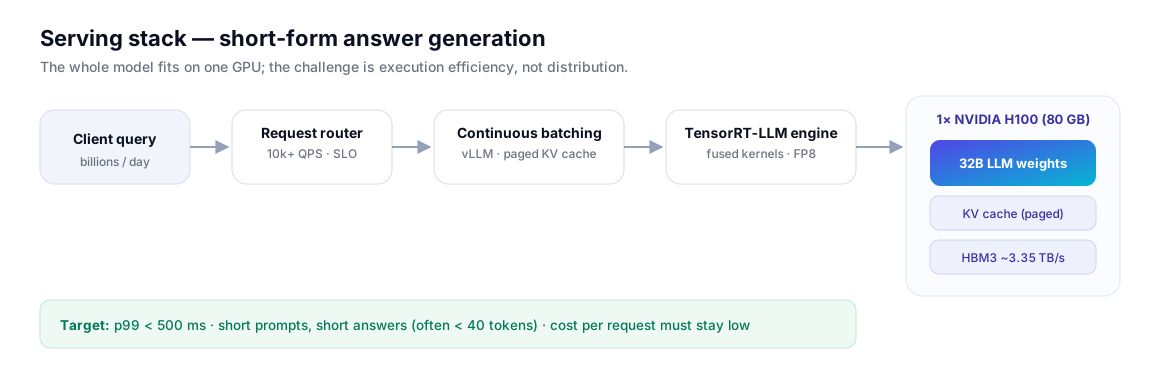 Figure 1. The whole model fits on one GPU, so this is an execution-efficiency problem, not a distribution problem.
Requests hit a router, enter a continuous-batching layer (vLLM) that interleaves many requests to keep the GPU fed, and run on a TensorRT-LLM engine that compiles the model into optimized, fused kernels. Serving uses FP8 weights and a paged KV cache. Crucially, the entire 32B model lives on a single H100 — so there is no NCCL, no expert parallelism, no fabric. Every millisecond is won or lost inside one GPU, which is exactly where kernel fusion lives.
4. Baseline assumptions
What we believed before measuring:
- Attention compute dominates decode latency.
- GPU utilization is the ceiling — push it up and throughput follows.
- The workload is compute-bound, so more or bigger GPUs is the lever.
- Kernel overhead is negligible next to the matrix multiplies.
All four were wrong for this workload, and the roofline explains why.
5. Benchmark environment
| Component | Configuration |
|---|---|
| GPU | 1× NVIDIA H100 (80 GB SXM), HBM3 ~3.35 TB/s |
| Model | 32B-class dense decoder, FP8 weights |
| Runtime | vLLM continuous batching + TensorRT-LLM engine |
| KV cache | paged, FP8 |
| Workload | short prompts, short answers (often < 40 tokens) |
| Profilers | Nsight Systems, Nsight Compute, Triton/GenAI perf tools, DCGM |
The defining trait again: decode-heavy with short outputs. Decode generates one token per step, so each step reads the model's weights to produce a single column of activations — a lot of memory movement for very little arithmetic.
6. Initial observations
The symptoms were the classic "looks fine, isn't fast":
| Metric | Value |
|---|---|
| GPU utilization (nvidia-smi) | ~52% |
| SM occupancy | ~58% |
| TTFT | ~210 ms |
| Throughput | below target |
The trap is reading nvidia-smi "GPU-Util" as efficiency. That counter only reports
the fraction of time a kernel was resident — not whether that kernel was doing useful
math or stalling on memory. A GPU can show 52% while the other 48% is launch gaps, and
the 52% itself can be memory-stalled.
7. Profiling the inference path
We profiled before changing anything.
# Per-step timeline with CUDA, NVTX, and cuDNN traces
nsys profile -t cuda,nvtx,cudnn -o decode_step \
  --capture-range=cudaProfilerApi python serve.py

# Per-kernel: is each kernel memory-bound or compute-bound?
ncu --set full -k regex:".*" -c 50 python serve.py
Nsight Systems showed a decode step decomposed into a long sequence of small kernels — RMSNorm → RoPE → QKV projection → attention → MLP — separated by visible launch-and-sync gaps. Nsight Compute confirmed the verdict per kernel: the elementwise and projection kernels reported high memory throughput and low compute throughput — the fingerprint of a memory-bound kernel.
8. The hidden cost of intermediate tensors
Here is the mechanism. In an unfused pipeline, every operation writes its output to HBM and the next operation reads it back:
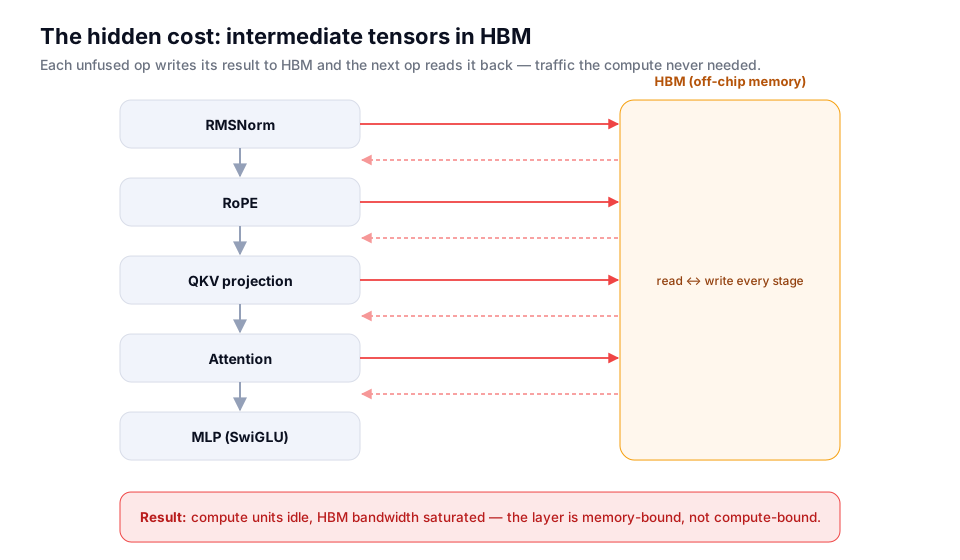 Figure 2. Each unfused op materializes its result in HBM; the next op reads it back. The data round-trips off-chip even though the next op needs it immediately.
Those round-trips are pure overhead. RMSNorm produces a tensor only RoPE consumes; RoPE produces a tensor only the QKV projection consumes. Writing each to HBM and reading it back burns the GPU's scarcest resource — memory bandwidth — to move data that never needed to leave the chip. With short outputs, there is no long generation over which to amortize this. The layer becomes memory-bound: compute units idle while HBM saturates.
9. Kernel-launch overhead
A second tax compounds the first. Every kernel must be launched by the host and often synchronized. Each token's forward pass triggers dozens of launches across the layers. At the small effective batch sizes typical of latency-sensitive serving, that per-launch cost is not noise — it is a meaningful fraction of step latency. It is most visible exactly where this platform lives: short responses, where you pay the fixed per-step overhead on every one of a handful of tokens.
10. Why decode is memory-bound — the roofline
The cleanest way to see all of this is the roofline model.
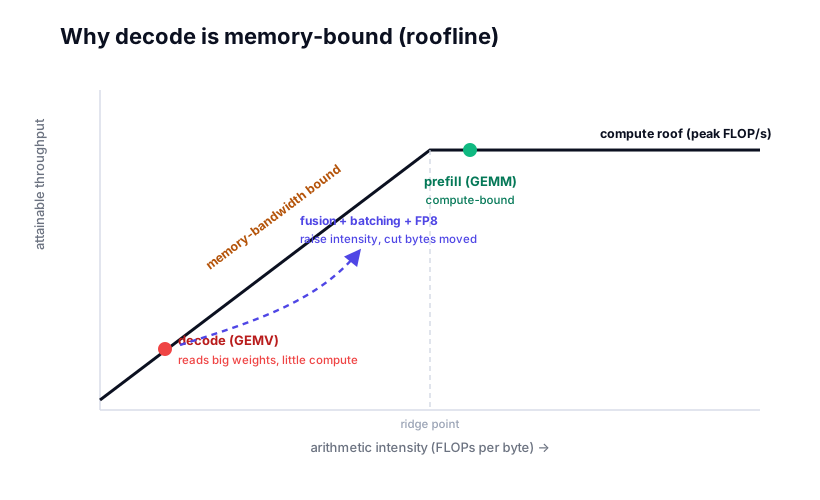 Figure 3. Decode is a near-GEMV operation with very low arithmetic intensity, so it sits on the bandwidth-bound slope — far from the compute roof. Prefill (GEMM) sits near the roof. Optimizations work by moving the decode point up and to the right.
Arithmetic intensity is FLOPs performed per byte moved. A GEMM-heavy prefill has high intensity and sits near the compute roof. Autoregressive decode is effectively a matrix–vector product: it reads enormous weight matrices to compute a single token's worth of output — intensity of roughly 1–2 FLOPs/byte, deep in the memory-bound region. On an H100 the ridge point is on the order of hundreds of FLOPs/byte, so decode isn't close. No amount of extra compute helps a point sitting on the bandwidth slope; you have to move fewer bytes or do more work per byte.
That single insight reframes every optimization below.
11. Kernel-fusion strategy
Fusion attacks both taxes at once: it eliminates intermediate HBM round-trips (activations stay in registers/SRAM between fused stages) and collapses many launches into few.
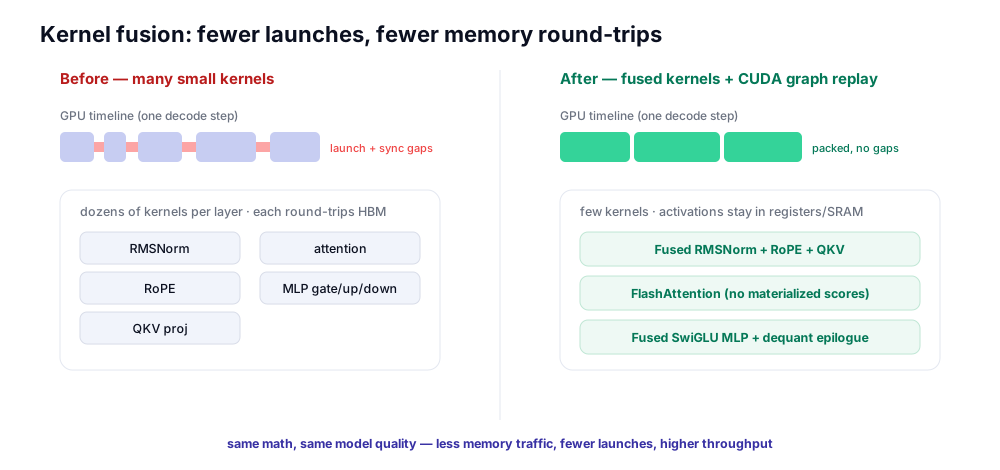 Figure 4. Same mathematics, same outputs — fewer kernels, fewer memory round-trips, no launch gaps.
The concrete moves, all delivered by TensorRT-LLM's compilation passes and vLLM's runtime:
- Vertical fusion of the pre-attention stack — RMSNorm + RoPE + QKV projection become one kernel, so the normalized, rotated activations never touch HBM.
- FlashAttention — an IO-aware, fused attention kernel that never materializes the full attention-score matrix, computing it tile-by-tile in on-chip SRAM.
- Fused MLP (SwiGLU) — gate, up, activation, and down projections fused with the activation function folded in.
- Epilogue and dequant fusion — bias/activation folded into the GEMM epilogue, and for FP8/INT8, dequantization fused into the matmul so weights move as fewer bytes and are converted in-register.
- CUDA Graphs — capture the per-step kernel sequence once and replay it, eliminating per-launch host overhead and synchronization for the steady-state decode loop.
- Continuous batching + PagedAttention (vLLM) — pack more requests into each step, which raises arithmetic intensity by amortizing each weight read across more tokens, nudging the operating point toward the compute roof. The tradeoff is that bigger batches can add queueing latency, so batch size is tuned against the p99 SLO.
- FP8 weights and KV cache — halve the bytes moved per step, directly relieving the bandwidth bottleneck. The tradeoff is accuracy, validated against quality metrics before rollout.
Notice that fusion and CUDA Graphs change how the math executes, not what it computes — so model quality is unchanged. Quantization is the one lever that trades a little accuracy for bandwidth, and it is gated on evaluation.
12. Results
| Metric | Before | After |
|---|---|---|
| TTFT | 210 ms | 150 ms |
| Decode tokens/sec | 120 | 195 |
| GPU memory-bandwidth utilization | 52% | 76% |
| Throughput | 1.0× | 1.7× |
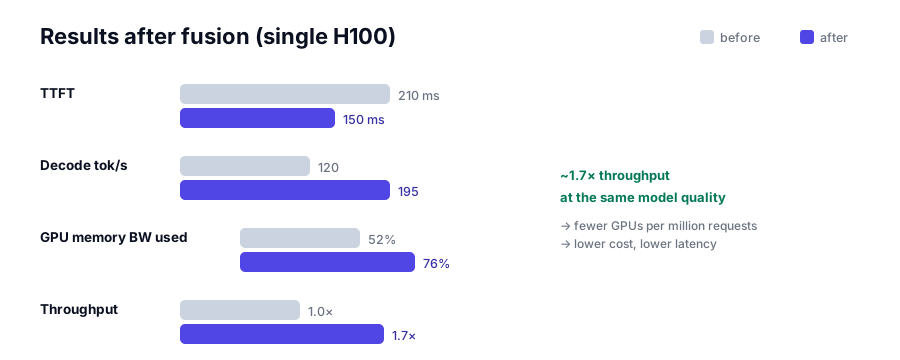 Figure 5. ~1.7× throughput at the same model quality — which translates directly into fewer GPUs per million requests.
The win is not a flashy benchmark number; it is cost per request. ~1.7× throughput on the same silicon means roughly 40% fewer GPUs to serve the same traffic, lower energy, and a faster answer for the user — multiplied across billions of requests a day.
13. Why this matters at billions per day
Short-form, latency-critical serving inverts the usual intuition. In a chat assistant generating long responses, per-step overhead amortizes over hundreds of tokens. In answer generation — a sentence or two — it does not. The fixed costs are the cost. That is precisely why memory-traffic and launch overhead, which a casual benchmark on long sequences would hide, become the deciding factors at this scale, and why fusion pays for itself many times over.
14. Production: profiling, serving, and monitoring
Sustaining the gain in production required three disciplines.
Profiling as a habit, not an event. Periodic Nsight Systems captures and NVTX-annotated kernel spans on a sample of hosts catch fusion regressions (a framework upgrade that silently un-fuses a kernel) as a metric rather than a customer report.
Serving configuration. Continuous batching with chunked prefill keeps prefill from starving decode; prefix caching reuses shared prompt prefixes; max-batch and KV-cache block sizes are tuned to sit just inside the p99 budget.
Monitoring the right signals. The dashboards that mattered were not GPU-Util but:
- TTFT and inter-token latency (ITL/TPOT) against the p99 SLO;
- DCGM memory-bandwidth activity (e.g.
DCGM_FI_PROF_DRAM_ACTIVE) and SM activity, to confirm the workload is using bandwidth efficiently rather than stalling; - kernel count and launch overhead per step, the leading indicator that fusion or CUDA Graphs have regressed;
- tokens/sec per GPU and cost per million tokens, the business-facing numbers.
The guiding principle mirrors the networking study: measure the real bottleneck — here, bytes moved and launches paid — because GPU-Util will lie to you.
15. Tradeoffs and lessons
- Not every inference workload is compute-bound. Short-form decode is memory-bound.
- Memory movement often dominates latency more than raw FLOPs.
- Kernel fusion improves throughput without changing model quality. It is among the highest-leverage, lowest-risk optimizations available.
- GPU utilization alone is misleading. Use roofline and per-kernel memory/compute throughput to know which wall you're hitting.
- Profile before you optimize, and before you buy GPUs. The cheapest capacity is the capacity you already have but aren't using.
16. Open questions
- How far can batching push decode toward the compute roof before latency SLOs bite?
- What is the right quantization frontier (FP8 vs INT8 vs mixed) for short-form quality at minimum bytes-moved?
- Can serving runtimes auto-select fused kernels and CUDA-Graph capture per request shape, rather than requiring hand-tuning?
- What is a good standard metric for inference efficiency — perhaps "useful FLOPs per byte of HBM traffic at the p99" — that teams could compare against?
17. Key takeaways
- Large-scale AI search answer generation is an infrastructure problem as much as a model problem.
- Memory bandwidth, not compute, is frequently the bottleneck for short-form LLM decode on datacenter GPUs.
- Kernel fusion (TensorRT-LLM, FlashAttention, fused MLP/epilogue) plus CUDA Graphs cut memory traffic and launch overhead at no quality cost.
- Continuous batching and FP8 raise arithmetic intensity and shrink bytes moved, moving the workload off the bandwidth wall.
- At billions of requests per day, single-digit-millisecond efficiencies decide GPU count, cost, and latency.
References
- M. Williams, A. Waterman, D. Patterson, Roofline: An Insightful Visual Performance Model for Multicore Architectures, Communications of the ACM, 2009.
- T. Dao et al., FlashAttention: Fast and Memory-Efficient Exact Attention with IO-Awareness, NeurIPS 2022 (arXiv:2205.14135).
- T. Dao, FlashAttention-2: Faster Attention with Better Parallelism and Work Partitioning, 2023 (arXiv:2307.08691).
- W. Kwon et al., Efficient Memory Management for Large Language Model Serving with PagedAttention (vLLM), SOSP 2023 (arXiv:2309.06180).
- R. Pope et al., Efficiently Scaling Transformer Inference, 2022 (arXiv:2211.05102).
- P. Micikevicius et al., FP8 Formats for Deep Learning, 2022 (arXiv:2209.05433).
- N. Shazeer, GLU Variants Improve Transformer (SwiGLU), 2020 (arXiv:2002.05202).
- J. Su et al., RoFormer: Enhanced Transformer with Rotary Position Embedding (RoPE), 2021 (arXiv:2104.09864).
- B. Zhang, R. Sennrich, Root Mean Square Layer Normalization (RMSNorm), NeurIPS 2019 (arXiv:1910.07467).
- NVIDIA, TensorRT-LLM Documentation — fusion passes, in-flight batching, FP8.
- NVIDIA, Nsight Systems and Nsight Compute user guides — timeline and per-kernel roofline analysis.
- NVIDIA, CUDA Graphs (CUDA C++ Programming Guide) and Data Center GPU Manager (DCGM) profiling metrics.
Part of an ongoing architecture-study series. The companion piece looks at the opposite regime — when the bottleneck is the network, not the GPU — in large-scale Mixture-of-Experts inference.